Prometheus Middleware#
Blacksmith can expose api calls metrics using Prometheus.
It requires the extra dependency prometheus_client installed using the following command.
pip install blacksmith[prometheus]
Or using poetry
poetry add blacksmith -E prometheus
To use the prometheus middlware, it has to be added to the ClientFactory.
All the available metrics are defined in blacksmith.PrometheusMetrics,
histograms buckets can be configured, and some metrics are exposed using other
middleware, such as the HTTP Cache Middleware or the
Circuit Breaker Middleware.
Usage example#
Async#
from blacksmith import (
    AsyncClientFactory,
    AsyncConsulDiscovery,
    AsyncPrometheusMiddleware,
)

sd = AsyncConsulDiscovery()
cli = AsyncClientFactory(sd).add_middleware(AsyncPrometheusMiddleware())
Sync#
from blacksmith import SyncClientFactory, SyncConsulDiscovery, SyncPrometheusMiddleware

sd = SyncConsulDiscovery()
cli = SyncClientFactory(sd).add_middleware(SyncPrometheusMiddleware())
Default Metrics#
While installing the metrics collector, it will add metrics on api call made.
There is blacksmith_request_latency_seconds Histogram and blacksmith_info Gauge.
blacksmith_request_latency_seconds Histogram#
Histogram have 3 metrics that are blacksmith_request_latency_seconds_count,
blacksmith_request_latency_seconds_sum and
blacksmith_request_latency_seconds_bucket.
All those metrics are incremented on every API calls.
You may configure the buckets using the parameter buckets
from blacksmith import PrometheusMetrics, AsyncPrometheusMiddleware

BUCKETS = [0.05, 0.1, 0.2, 0.4, 0.8, 1.6, 3.2, 6.4, 12.8, 25.6]
metrics = PrometheusMetrics(buckets=BUCKETS)
middleware = AsyncPrometheusMiddleware(metrics)
blacksmith_request_latency_seconds labels are client_name, method,
path, status_code.
Note
The client_name can indicated the service at its version, and, because a service can register the same method/path many times, it can be usefull to get the monitoring on every binding.
Imagine the same route is consumed to get different aspect of the resource in many place of a code base. It can be appropriate to register different clients to distingate them.
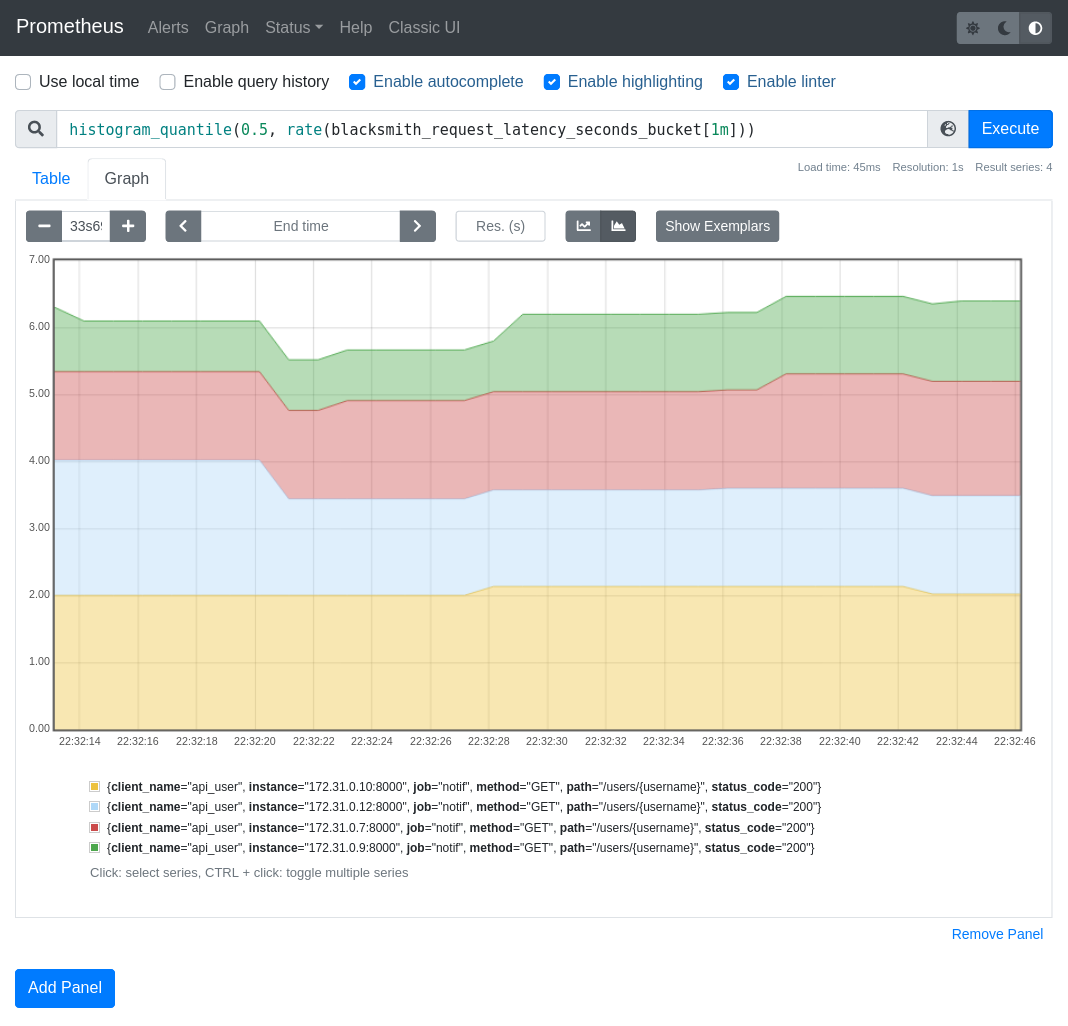
Example of blacksmith_request_latency_seconds Histogram#
blacksmith_info Gauge#
The metrics is blacksmith_info which is a Gauge that always return 1, it is usefull
to get the version of the blacksmith client installed, in its label version.
More Metrics by combining middlewares#
blacksmith_circuit_breaker_state Gauge#
While combining with the Circuit Breaker Middleware,
a metrics blacksmith_circuit_breaker_state Gauge is added to get the
states of circuit breakers per client_name.
0 - the circuit breaker is closed.
1 - the circuit breaker is half-open.
2 - the circuit breaker is open.
blacksmith_circuit_breaker_error Counter#
While combining with the Circuit Breaker Middleware,
a metrics blacksmith_circuit_breaker_error_total count the number
of errors of service.
blacksmith_cache_hit#
While combining with the HTTP Cache Middleware, a metrics
blacksmith_cache_hit_total count the number of responses served
from the cache.
blacksmith_cache_miss#
While combining with the HTTP Cache Middleware, a metrics
blacksmith_cache_miss_total count the number of responses that cannot
be served from the cache.
The cachable_state label indicated if the data is cachable or not.
Sometime the request is not cachable (the default policy cache only GET),
sometime the response does not have a cache header, so it cannot be cached.
The cachable state can only contains uncachable_request, uncachable_response, cached.
When the response is cached, then the next request will be a hit (except if
the cache has expired).
blacksmith_cache_latency_seconds Histogram#
Histogram have 3 metrics that are blacksmith_cache_latency_seconds_count,
blacksmith_cache_latency_seconds_sum and blacksmith_cache_latency_seconds_bucket.
It can be used to measure the performance of the cache.
from blacksmith import PrometheusMetrics, AsyncPrometheusMiddleware

CACHE_BUCKETS = [0.005, 0.01, 0.02, 0.04, 0.08, 0.16, 0.32, 0.64, 1.28, 2.56]
metrics = PrometheusMetrics(hit_cache_buckets=CACHE_BUCKETS)
middleware = AsyncPrometheusMiddleware(metrics)
Expose metrics#
After collecting metrics in the registry, the metrics has to be exposed, because blacksmith is a client purpose API, it does not offer a way to expose them, but, usually, a web framework application is used for that, and used scrapped by a Prometheus instanced.
Example using starlette#
from prometheus_client import (
   generate_latest, CONTENT_TYPE_LATEST, REGISTRY
)
from starlette.applications import Starlette
from starlette.responses import Response

app = Starlette()

@app.route("/metrics", methods=["GET"])
async def get_metrics(request):
   resp = Response(
      generate_latest(REGISTRY),
      media_type=CONTENT_TYPE_LATEST,
      )
   return resp
Note
REGISTRY is the default registry, PrometheusMetrics can be build by specifying another registry if necessary:
from blacksmith import AsyncPrometheusMiddleware
prom_middleware = AsyncPrometheusMiddleware(registry=my_registry)
Full examples of prometheus metrics#
You will find an example using prometheus in the examples directory: